

Obamacare Cost 2018
Not since the first year of Obamacare plans in 2014 has a new plan year attracted so much attention and trepidation. A confluence of news reports on higher rate requests from insurers, counties with only a single insurance company on-exchange, and debates over the continuation of cost-sharing subsidies have kept private health insurance at their forefront of the news cycle in recent months. So how much did Obamacare cost in 2018?
Using government data released on Affordable Care Act (ACA) health plans in 39 states, HealthPocket analyzed average the market premiums and obamacare cost in 2018 and compared them to last year’s averages. Moreover, with respect to cost-sharing obligations, averages for individual and family deductibles were examined as were annual caps out-of-pocket costs.
Coming on the heels of 2017 where average unsubsidized premiums rose by double-digits, obamacare cost in 2018 has brought even more dramatic price increases which not only increases economic burdens on consumers who buy health insurance plans without subsidization but also limits the ability of the ACA to expand its penetration of the unsubsidized population.
Average Plan Expenses By Metal Tier
Below is the comparison of average premiums and obamacare cost in 2018 across the United States. The averages are compiled according to the four standard metal tiers for Affordable Care Act (ACA) health plans. Note that the premium and cost-sharing averages assume a nonsmoking individual insurance applicant and does not include any government premium subsidies that might be applied. No weighting on the plans available on the market were performed to reflect which plans consumers would choose among the available options.
Comparative 2017 average premiums are based on the same type of government landscape data files that were used for the 2018 average premiums. Since the market conditions facing insurance buyers are evaluated in this study rather than behavior in response to those conditions, no weighting by enrollment was performed on the health plan data.
Individual and family obamacare cost 2018 averages are provided for deductibles as well as the annual limits on out-of-pocket costs for covered medical services delivered by in-network healthcare providers (labeled in the tables as “Maximum Annual Out-of-Pocket Costs”). For 2018 ACA plans, HHS announced that the maximum allowable cost-sharing (including out-of-pocket costs for deductibles, co-payments, and co-insurance) is “7,350 for self-only coverage and $14,700 for other than self-only coverage.” “Other than self-only coverage” refers to insurance coverage of more than one person such as the coverage of a family.
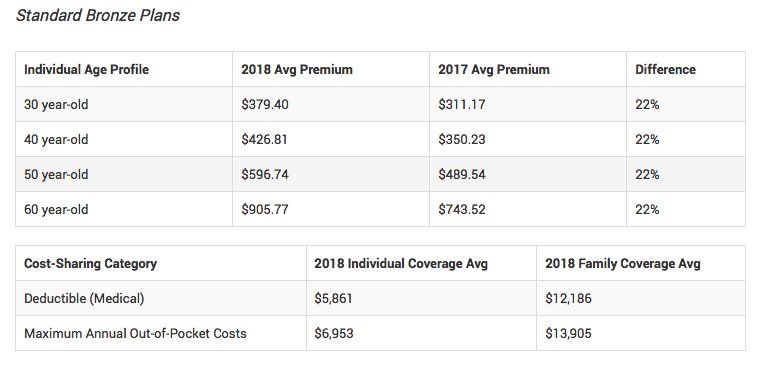
Bronze Plans
The 2018 plan year shall include “expanded Bronze Plans” that are allowed by the government to have slightly lower coverage of medical expenses in the hopes of bringing lower premiums. The ACA originally set the actuarial value for Bronze Plans at 60 percent, meaning that for a standard population of enrollees Bronze plans were required to cover 60% of costs for covered medical expenses delivered from in-network healthcare providers. Normally, ACA plans have a de minimis variation of 2 percent, which for a Bronze Plan means that its actuarial value can be in the range of 58 percent to 62 percent and still be compliant. In 2018, the de minimis range for ACA plans has been expanded so that it can be up to four percent below the 60 percent actuarial value (the upper bound is still two percent).4 Below we have comparisons of the costs for the standard Bronze Plans to the expanded Bronze Plans. With respect to the expanded Bronze Plans, they represent approximately 25 percent of all Bronze Plan records within the government data.

Silver Plans
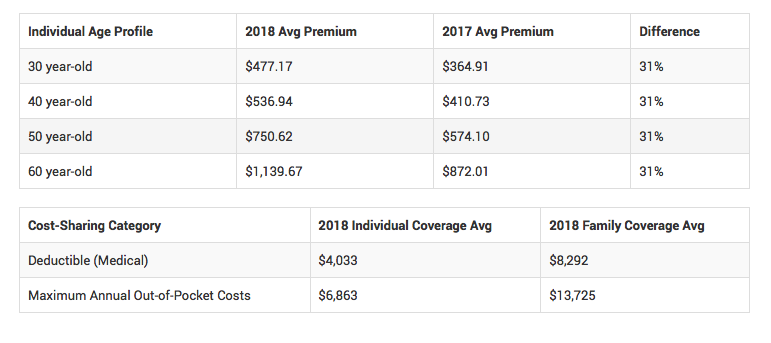
Silver Plans have been the most popular of ACA health plans since their market availability in 2014 plan year. Consumers shopping for these plans on-exchange face the steepest average price increase in 2018. When reviewing all plans made public for 39 states, HealthPocket found that the average Silver Plan premium is 31 percent more expensive in 2018 as compared in 2017. 31 percent was the highest increase when comparing increases for the four standard ACA plans (Bronze, Silver, Gold, and Platinum). For a sixty year-old nonsmoking health insurance consumer, this would put the average monthly premium nationally above $1,100 a month as compared to less than $900 a month in 2017.
2018’s 31 percent increase in average premium comes after last year’s 17 percent increase in average premium for exchange plans available nationally. Additionally, when comparing the average Silver Plan deductible for an individual, 2018 also brings an 13 percent increase in deductible expense ($4,033 in 2018 compared to $3,572 in 2017).
Gold Plans
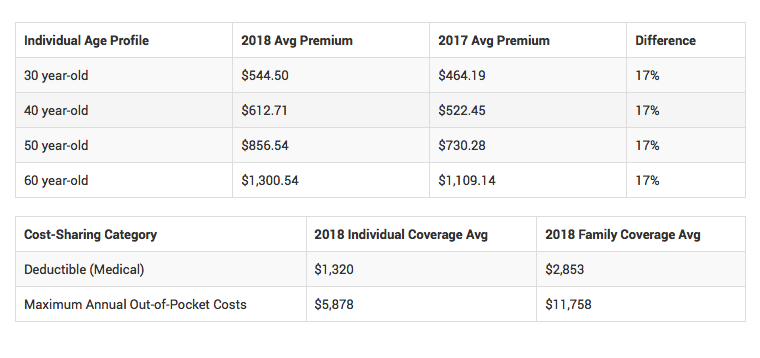
For insurance companies participating on exchanges, they must offer at least one Silver Plan and one Gold Plan. Gold Plans are especially important to consumers with high medical utilization since Gold Plans have lower out-of-pocket obligations than Bronze and Silver Plans and are more widely available than Platinum Plans.
The average market premiums for Gold Plans in 2018 will be 17% higher than observed in 2017. Gold Plans will also see average deductibles rise in 2018 as well as the caps on annual out-of-pocket expenses.
Platinum Plans
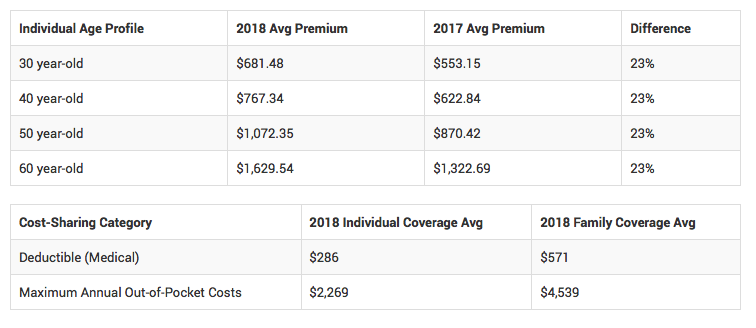
While Platinum Plans typically have the lowest out-of-pocket costs among the four standard types of ACA plans, they are not offered by every insurance company and represent a small portion of the exchange market. One of the reasons for their minor market presence may be insurer concerns that they would attract consumers who are less healthy and, as a consequence, use healthcare services more frequently.
As with other standard ACA health plan types, the average Platinum Plan premium faces a double-digit increase in 2018. For Platinum Plans, the average premium is 23 percent higher in 2018 as compared to 2017.
For more data and comprehensive analysis about the obamacare cost in 2018 and insurance premium costs on the ACA exchanges, visit Health Pocket.
How Much is Obamacare in 2019?
A major change for this year is that the individual mandate penalty we saw in previous years, which consisted of 2.5% of one’s yearly household income, or $695 per adult, whichever was greater, was removed as of January 1st, 2019. This change affected the obamacare cost in 2019.
For this year, premiums for all Obamacare health plans, will be on average about 6% higher than they would have been if it weren’t for the repeal of the penalty. This is especially visible in Obamacare silver plans sold in the marketplaces. For 2019, these will cost about 16% more because of the recent health insurance regulation changes.
For example, the 2019 silver plan monthly premiuObamacare-premium -cost-chartms for a 40-year-old on healthcare.gov would have averaged $427 in 2019, but are $495 instead as reported by the Department of Health and Human Services.
Below is a look at the premium changes comparing Obamacare cost in 2018 and 2019:
| Table 1: Monthly Unsubsidized Bronze, Benchmark, and Gold Premiums for a 40 Year Old Non-Smoker | ||||||||||
|
State</Obamacare-premium -cost-chartdiv>
|
Major City | Lowest Cost Bronze Before Tax Credit |
2nd Lowest Cost Silver Before Tax Credit |
Lowest Cost Gold Before Tax Credit |
||||||
| 2018 | 2019 | % Change from 2018 | 2018 | 2019 | % Change from 2018 | 2018 | 2019 | % Change from 2018 | ||
| Alabama | Birmingham | $372 | $327 | -12% | $546 | $525 | -4% | $612 | $616 | 1% |
| Alaska | Anchorage | $526 | $461 | -12% | $709 | $696 | -2% | $759 | $655 | -14% |
| Arizona | Phoenix | $405 | $333 | -18% | $513 | $426 | -17% | $621 | $574 | -8% |
| Arkansas | Little Rock | $309 | $320 | 4% | $378 | $381 | 1% | $424 | $469 | 11% |
| California | Los Angeles | $247 | $281 | 14% | $360 | $376 | 4% | $398 | $405 | 2% |
| Colorado | Denver | $338 | $336 | -1% | $413 | $466 | 13% | $459 | $480 | 5% |
| Connecticut | Hartford | $306 | $297 | -3% | $484 | $428 | -12% | $545 | $542 | -1% |
| Delaware | Wilmington | $473 | $449 | -5% | $591 | $685 | 16% | $706 | $672 | -5% |
| DC | Washington | $271 | $316 | 17% | $324 | $393 | 21% | $385 | $426 | 11% |
| Florida | Miami | $297 | $332 | 12% | $442 | $447 | 1% | $456 | $476 | 4% |
| Georgia | Atlanta | $371 | $316 | -15% | $421 | $440 | 5% | $465 | $497 | 7% |
| Hawaii | Honolulu | $336 | $361 | 7% | $456 | $503 | 10% | $449 | $469 | 4% |
| Idaho | Boise | $290 | $282 | -3% | $463 | $479 | 3% | $464 | $480 | 3% |
| Illinois | Chicago | $305 | $328 | 8% | $411 | $384 | -7% | $488 | $442 | -9% |
| Indiana | Indianapolis | $323 | $350 | 8% | $366 | $377 | 3% | $501 | $498 | -1% |
| Iowa | Cedar Rapids | $570 | $429 | -25% | $702 | $724 | 3% | $781 | $528 | -32% |
| Kansas | Wichita | $344 | $375 | 9% | $484 | $529 | 9% | $445 | $485 | 9% |
| Kentucky | Louisville | $282 | $274 | -3% | $397 | $370 | -7% | $446 | $506 | 13% |
| Louisiana | New Orleans | $363 | $336 | -7% | $409 | $384 | -6% | $509 | $484 | -5% |
| Maine | Portland | $337 | $335 | -1% | $513 | $485 | -5% | $570 | $582 | 2% |
| Maryland | Baltimore | $314 | $298 | -5% | $456 | $419 | -8% | $449 | $408 | -9% |
| Massachusetts | Boston | $233 | $251 | 8% | $305 | $321 | 5% | $347 | $334 | -4% |
| Michigan | Detroit | $219 | $225 | 3% | $332 | $333 | 0% | $341 | $355 | 4% |
| Minnesota | Minneapolis | $259 | $238 | -8% | $327 | $300 | -8% | $410 | $343 | -16% |
| Mississippi | Jackson | $492 | $474 | -4% | $551 | $542 | -2% | $687 | $648 | -6% |
| Missouri | St. Louis | $281 | $325 | 16% | $465 | $421 | -9% | $636 | $566 | -11% |
| Montana | Billings | $334 | $321 | -4% | $503 | $522 | 4% | $561 | $499 | -11% |
| Nebraska | Omaha | $532 | $473 | -11% | $752 | $821 | 9% | $753 | $586 | -22% |
| Nevada | Las Vegas | $291 | $292 | 0% | $384 | $369 | -4% | $416 | $404 | -3% |
| New Hampshire | Manchester | $391 | $303 | -23% | $475 | $402 | -15% | $524 | $444 | -15% |
| New Jersey | Newark | $322 | $279 | -13% | $411 | $348 | -15% | $646 | $538 | -17% |
| New Mexico | Albuquerque | $258 | $241 | -7% | $401 | $342 | -15% | $331 | $334 | 1% |
| New York | New York | $416 | $421 | 1% | $510 | $587 | 15% | $595 | $697 | 17% |
| North Carolina | Charlotte | $491 | $361 | -26% | $667 | $536 | -20% | $703 | $548 | -22% |
| North Dakota | Fargo | $254 | $277 | 9% | $298 | $388 | 30% | $382 | $392 | 3% |
| Ohio | Cleveland | $244 | $264 | 8% | $319 | $327 | 3% | $376 | $400 | 6% |
| Oklahoma | Okla. City | $377 | $334 | -11% | $685 | $686 | 0% | $690 | $486 | -30% |
| Oregon | Portland | $271 | $296 | 9% | $380 | $414 | 9% | $401 | $439 | 9% |
| Pennsylvania | Philadelphia | $401 | $370 | -8% | $636 | $465 | -27% | $539 | $517 | -4% |
| Rhode Island | Providence | $198 | $215 | 9% | $311 | $336 | 8% | $300 | $323 | 8% |
| South Carolina | Columbia | $393 | $405 | 3% | $562 | $603 | 7% | $590 | $607 | 3% |
| South Dakota | Sioux Falls | $346 | $330 | -5% | $453 | $448 | -1% | $509 | $521 | 2% |
| Tennessee | Nashville | $351 | $342 | -3% | $585 | $486 | -17% | $824 | $813 | -1% |
| Texas | Houston | $270 | $286 | 6% | $399 | $393 | -2% | $426 | $476 | 12% |
| Utah | Salt Lake City | $283 | $271 | -4% | $517 | $510 | -1% | $578 | $584 | 1% |
| Vermont | Burlington | $422 | $426 | 1% | $505 | $622 | 23% | $569 | $584 | 3% |
| Virginia | Richmond | $327 | $379 | 16% | $482 | $499 | 4% | $719 | $499 | -31% |
| Washington | Seattle | $264 | $319 | 21% | $339 | $380 | 12% | $406 | $436 | 7% |
| West Virginia | Huntington | $410 | $475 | 16% | $478 | $531 | 11% | $623 | $683 | 10% |
| Wisconsin | Milwaukee | $434 | $372 | -14% | $568 | $563 | -1% | $666 | $570 | -14% |
| Wyoming | Cheyenne | $534 | $531 | -1% | $796 | $796 | 0% | $657 | $660 | 0% |
SOURCE: Kaiser Family Foundation analysis of premium data from insurer rate filings to state regulators, healthcare.gov, and state plan finders